
GT Metrix webpage speed test, using this tool, knowing improvement
As an alternative to Google’s PageSpeed Insights tool, GTmetrix is a website page performance testing tool. It provides various additional benefits for more accurate graphic representation of data. Open the website https://gtmetrix.com/, type your website URL in the search box there, and voila! Now you can assess the speed of your website. The page speed of your website is visible. You can assess whether your website is user-friendly by seeing how well it performs on desktop and mobile.
That’s it, so simple to check the speed of the website’s page.
Another important thing here is that most of the people think that the result you are getting on GTMetrics is the speed of your website, but no, we want to break this misconception. This is the page speed of your website, not the entire website. Whatever URL you enter in the GTMetrics toolbar, the website returns the speed of that page. Therefore, the page speed of each page of the website may vary depending on various factors.
Within the topic, we also discuss other factors, below you can see different factors, the way to get the complete idea is to stay on the same page and click on GTMetrics related topics one by one, then you You will know what the problems are with your page speed.
4 Important factors for the GT Metrix Speed test
1)Number of tests-
You will need to run several speed tests to get complete data. Speed testing should be done at different times throughout the day. It is considered good to set it for 1 hour and leave it for about 1 week. This tells us how much your website’s performance changes throughout the day.
2)Test locations-
Location plays an important role. It all depends on how close your location server and target visitors are in the speed test. You should choose a location that is close to the server and target audience. If your website only targets one location, you should only be concerned about the testing results for that location and if you want to target a global audience, you will need 4 or 5 testing servers.
If you want to target different locations, you can choose a server from Europe and a server from Asia, a server from the US, and a server from Australia.
3)Test Targets-
It is seen that most of the people test only the homepage and this is the biggest mistake because the homepage is the most important page of our website and it should be given at least as much load time as the data that would be on our homepage page. , , it will take so long to load.
4)Test connection speeds/ devices-
Most people do desktop testing instead of mobile testing and ignore mobile testing, but this is the biggest mistake because more than half of the traffic comes from mobile. Apart from this, mobile speed may differ from desktop speed. This is because not everyone’s relationships are good.
Some will have 3G, then someone will have a 4G connection. Due to this, it may take time to load the page, you can see the speed of the website for free in GT Metrix.
How to use the GT Metrix speed test.
You can use the free basic version of GT Metrix. This will give you a basic understanding of what terms are used in the GT Matrix. First of all you have to register in it because it is a free version. You will get limited results in this. In this you will be able to use only Canada location, that too with slow connection. This will happen when you use GT metrics.
will ask for something like:
Location –
Test device-
Connection Speed -
You can check the speed after entering your URL. It will tell you how long it takes to load the speed of your website.

Once you run the test, GT Metrix shows you a summary box. It contains six pieces divided into two parts.
GT Metrix Grade
It shows you how well your website optimized
Letter grade –It shows how well your website grade in performance
Performance –It shows your lighthouse performance score of a website which is the same used by the google insights tool.
Structure-It shows your proprietary score that combines with lighthouse score with its own GT Metrix audit, which shows how well your page is optimized.
Web Vitals
It Focuses on google new core web vitals with actual performance data.
LCP — Largest Contentful Paint time measures how long to load a page’s ‘main’ content. Google recommends that your LCP time is under 2.5 seconds.
TBT — Total Blocking Time, which is a proxy for the First Input Delay (FID) metric in Core Web Vitals (FID is only available in real user data, so GTmetrix can’t directly test it). Google recommends that your TBT should be under 150 ms.
CLS — Cumulative Layout Shift metric from Core Web Vitals. It shows how much your content ‘moves’ as it loads. It is well considered if the CLS score should be under 0.1.
Four Best GtMetrix Alternative
Below are the best alternatives of GT Metrix you can use for analyzing website performance.
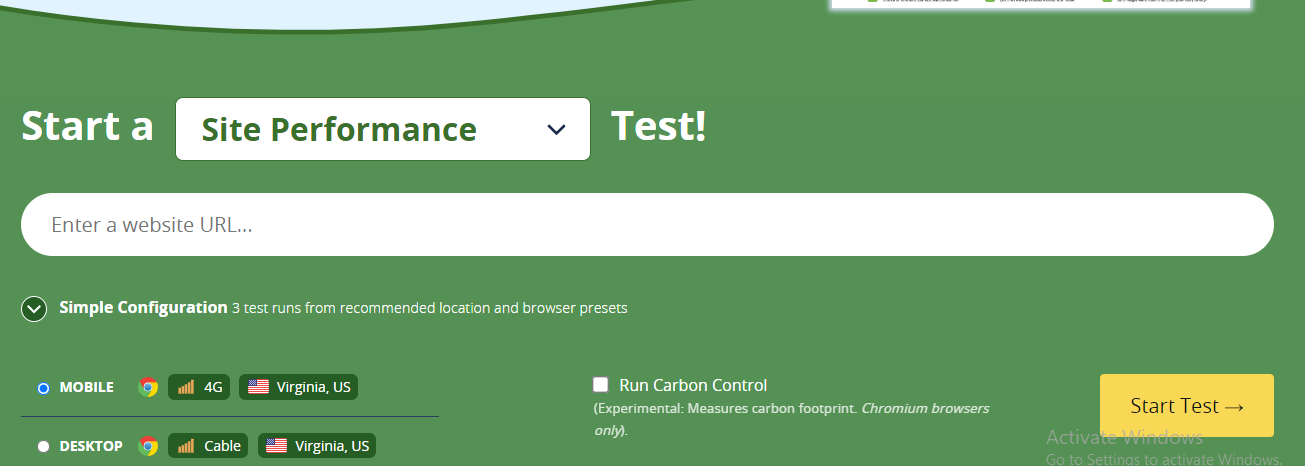
Webpagespeedtest
It is the best GT Metrix alternative you can consider for your website performance because it gives you flexibility for customizing your test for free of cost but because of free some parts of it are not as good as GT Metrix.
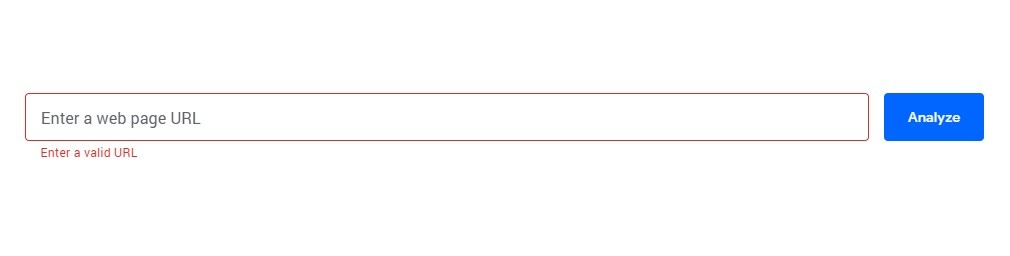
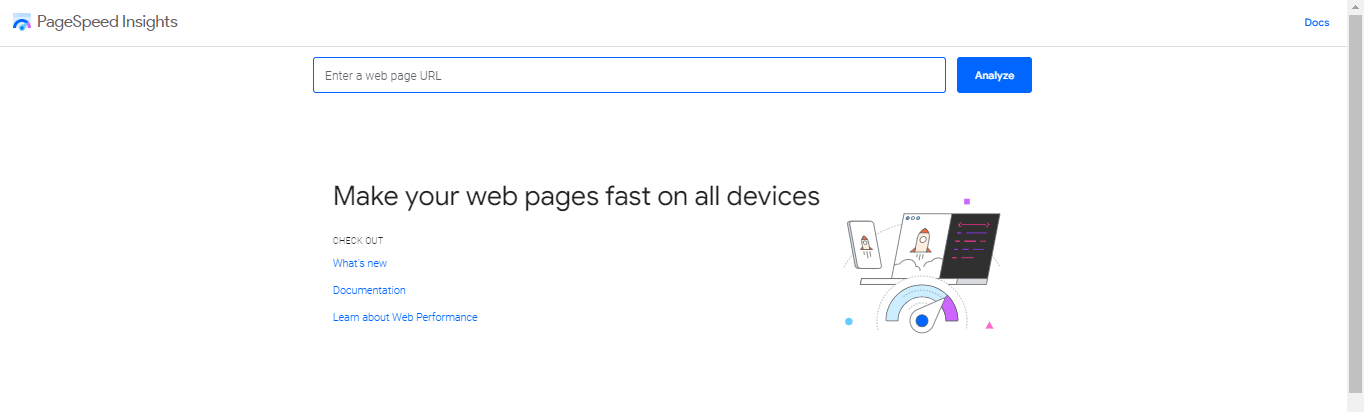
Pagespeed Insights
This is an official performance testing tool from Google and some of it is similar to GT Metrix but one advantage is that you can see real field data from the Chrome User Experience Report which helps you see input latency and other key issues earlier. Is. Web important points. One negative thing about this is that you cannot change the location and speed of the test.
Pingdom
It is an excellent alternative if you pay for it. There are a lot of features that are similar to GT Metrix. You can consider Pingdom in place of GT Metrix if you think it is more beneficial. Both have free and paid plans you can choose that you like.

Speed curve
It is the automatic performance monitoring tool for heavy-loading sites. One positive point is it gives you more data than GT Metrix and one negative point is it is more complicated than GT Metrix.


Leave A Comment